The Census Bureau’s 1Q26 Housing Vacancy Survey showed a rental market that continues to normalize from historically tight post-pandemic conditions, set against a for-sale market that remains supply-constrained in a manner without modern precedent. The two segments are moving in opposite directions, and the divergence is becoming more pronounced.
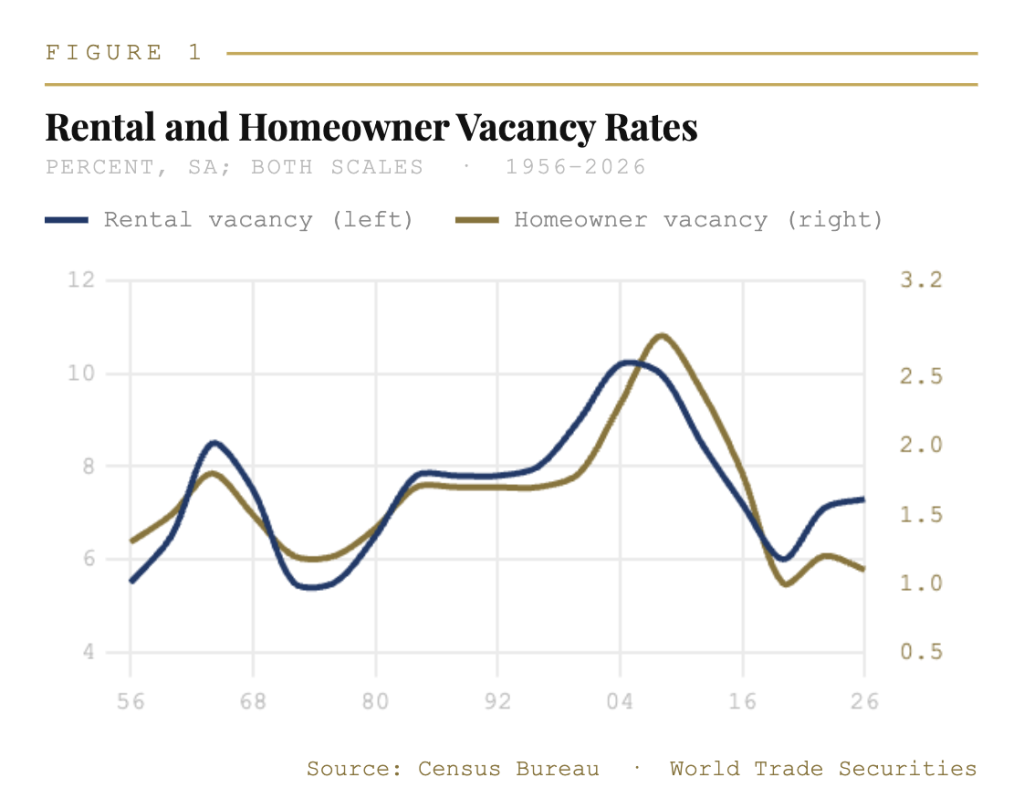
The rental vacancy rate edged up to 7.3% in 1Q26 from 7.2% in the prior quarter, extending a steady recovery from the post-pandemic low of 5.6% reached in 2Q22. The mechanism is straightforward: multifamily completions have continued to deliver new supply into the rental market at an elevated pace, while renter household formation has decelerated as the immigration-driven population surge that supported rental demand from 2022 through 2024 begins to reverse. The rental market is not loose by historical standards — 7.3% sits below the long-run average closer to 8–9% — but the directional trend is toward normalization, and rents in markets with the highest recent completion volumes are already reflecting it.
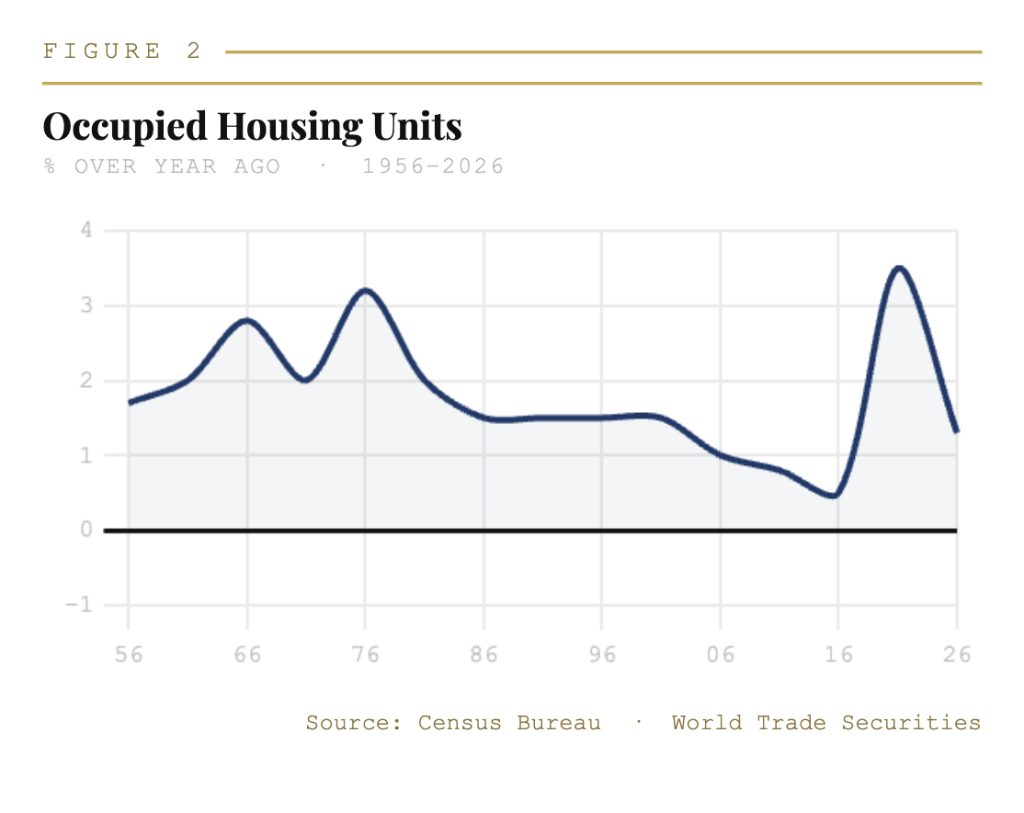
The for-sale market tells the opposite story. The homeowner vacancy rate ticked down to 1.1% in 1Q26 from 1.2% in the prior quarter, remaining near generational lows. Elevated mortgage rates have created a near-complete lock-in effect among existing homeowners who financed at the 2020–2021 lows — the so-called golden handcuff dynamic — suppressing resale inventory to levels that prevent the market from clearing at any price. Total occupied housing units rose by 1.66 million over the four quarters through 1Q26 to 133.7 million, driven primarily by owner-occupied units, suggesting that household formation is occurring but overwhelmingly through tenure transitions rather than entry into the ownership market by new buyers.
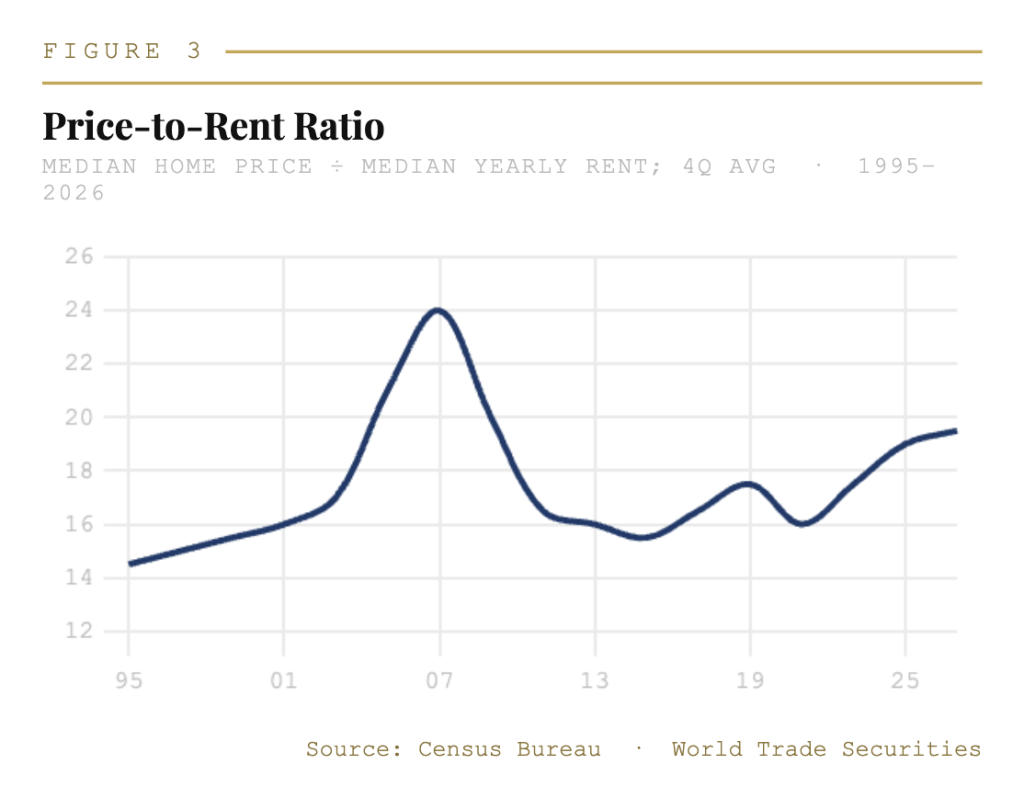
The price-to-rent ratio — median asking price for vacant for-sale units as a share of annualized median asking rent, on a four-quarter moving average — rose to 19.5 in 1Q26, its highest reading since the mid-2000s housing bubble. That comparison is instructive. In the mid-2000s, the elevated ratio reflected speculative excess and a credit environment that was funding purchases at any valuation. The current elevation reflects a genuine shortage of supply relative to demand, with mortgage rate lock-in preventing the inventory normalization that would bring the ratio down organically. The ratio at 19.5 is not a valuation anomaly. It is a direct expression of the structural deficit.
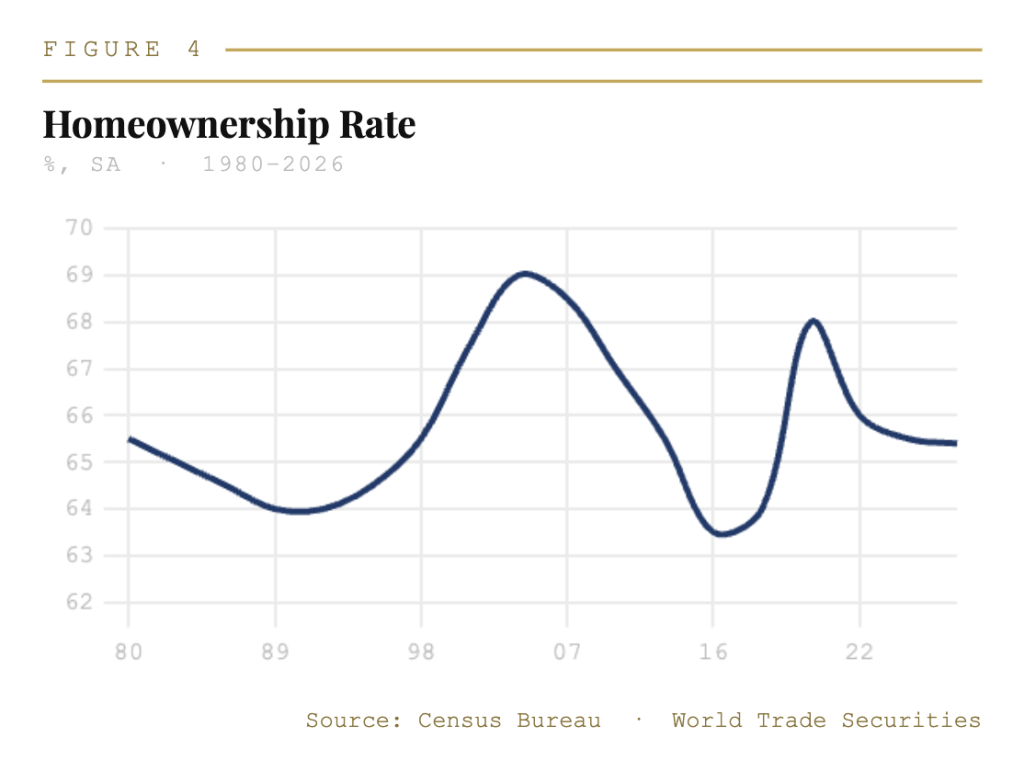
The national homeownership rate nudged down one tenth to 65.4% in 1Q26, remaining in the range that has prevailed since the post-financial-crisis deleveraging cycle bottomed out. The rate has recovered substantially from the 63.1% trough of 2016, and the pandemic-era spike to 68% was quickly unwound. At 65.4%, the rate is consistent with a housing market in which ownership remains broadly accessible to those who entered before the rate shock of 2022, and largely inaccessible to first-time buyers at current mortgage rates and current price levels. That bifurcation — between the locked-in incumbent owner and the priced-out prospective buyer — is the defining structural feature of the current housing market. The vacancy data confirm it is deepening, not resolving.